Quantified Self - Metrocard Months
I wanted to see in graphical form how many days of the month I used my metro card in recent months as a way to figure out whether it’s worth going back to unlimited monthly fares.
To get the data, I logged into my easypass account and then downloaded the data into csv files. Imported that CSV file into tableau to play with the drag and drop interface.
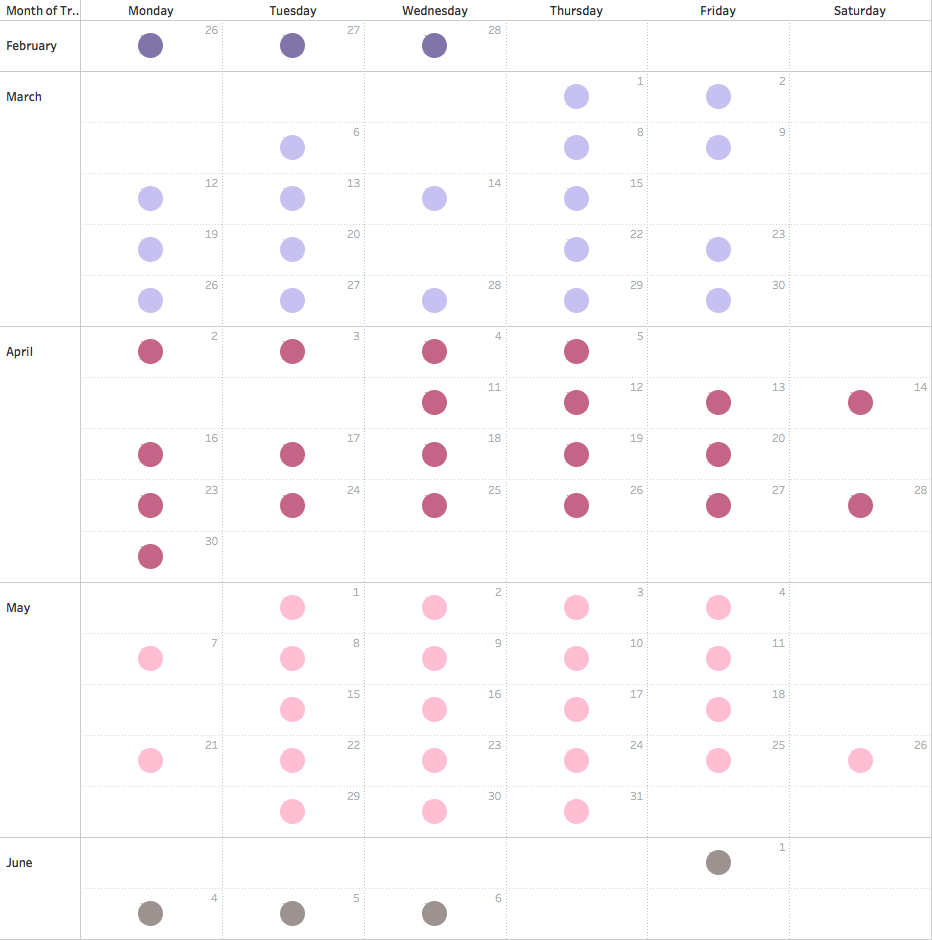
Here’s how I constructed the calendar view:
In the columns, I used the WEEKDAY() function to transform the transaction day into the day of weeks.
In the rows, I used the Month() function to show the month and then the WEEK() to break down the view into weeks.