First, I tried google maps API. It was easy to set up but very quickly I hit the API rate limit.
Example from Google:
function initMap() {
  var map = new google.maps.Map(document.getElementById('map'), {
    zoom: 8,
    center: {lat: -34.397, lng: 150.644}
  });
  var geocoder = new google.maps.Geocoder();

  document.getElementById('submit').addEventListener('click', function() {
    geocodeAddress(geocoder, map);
  });
}

function geocodeAddress(geocoder, resultsMap) {
  var address = document.getElementById('address').value;
  geocoder.geocode({'address': address}, function(results, status) {
    if (status === google.maps.GeocoderStatus.OK) {
      resultsMap.setCenter(results[0].geometry.location);
      var marker = new google.maps.Marker({
        map: resultsMap,
        position: results[0].geometry.location
      });
    } else {
      alert('Geocode was not successful for the following reason: ' + status);
    }
  });
}
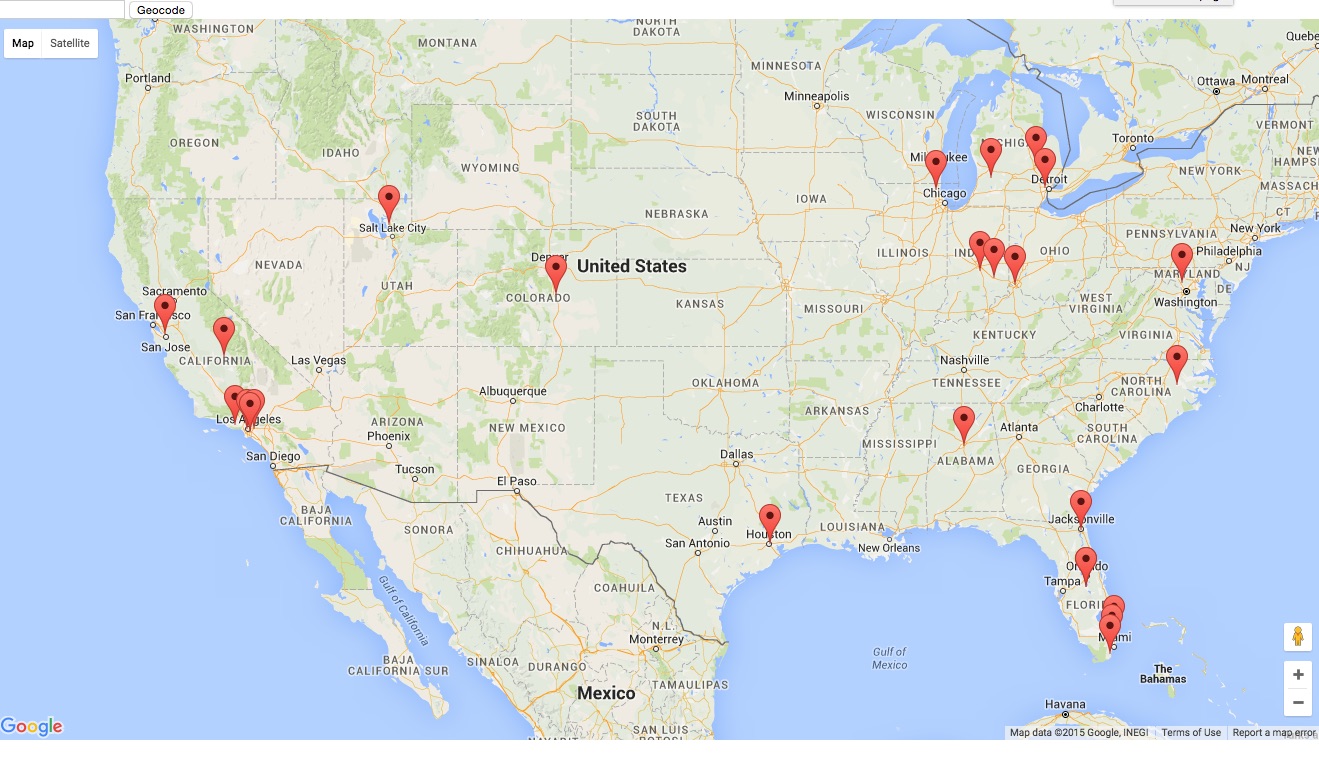
It produced a nice map with red markers. I’d end up with many more data points on a map and so continued looking for other options.
I next tried to use Kartograph.js, but I struggled a bit too long to get the geo information plotted.
In the end I went with LeafletJS because it was easy to customize and free to use.
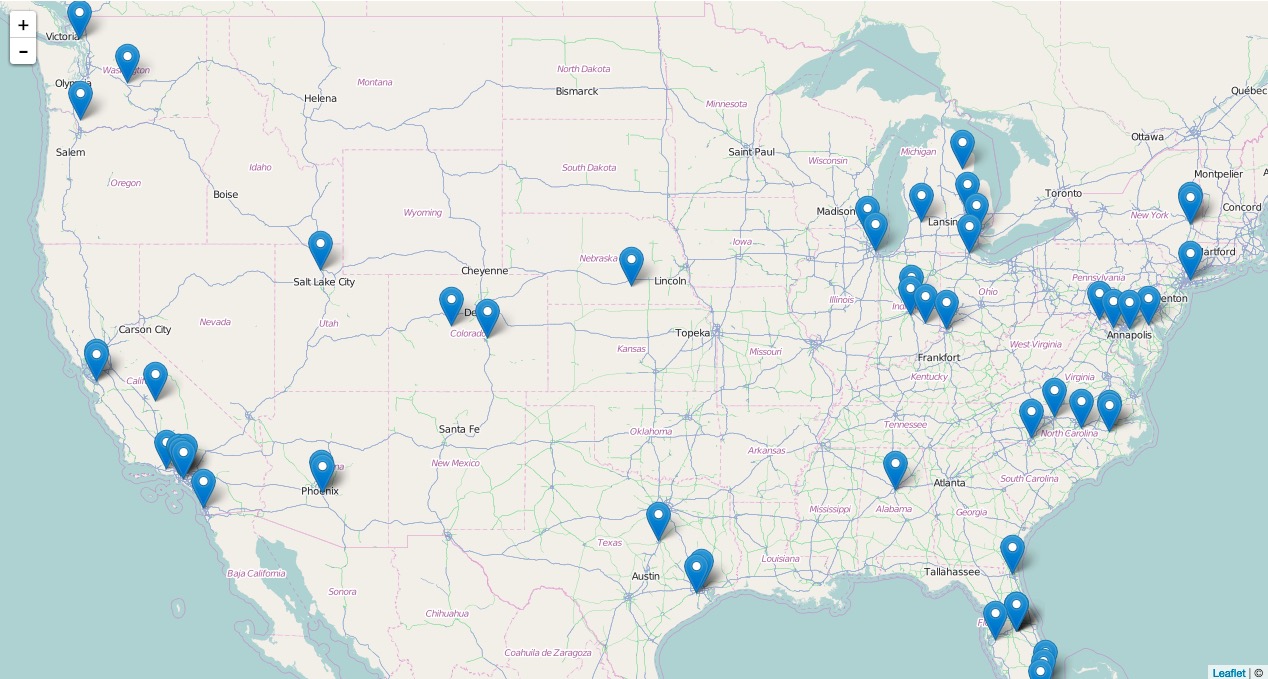
It’s easy to get started, as seen from their Leaflet Quick Start Guide
Add supporting files:
<link rel="stylesheet" href="http://cdn.leafletjs.com/leaflet-0.7.5/leaflet.css" />
<script src="http://cdn.leafletjs.com/leaflet-0.7.5/leaflet.js"></script>
Then you can configure the map…
var map = L.map('map').setView([40.7101, -84.0066], 4);
L.tileLayer('http://{s}.tile.osm.org/{z}/{x}/{y}.png', {
    attribution: '©',
    maxZoom: 18
}).addTo(map);
From there I went ahead with using markers with custom icons