In the summer of 2013, Complex released a list of the best sneaker cities in the world. The following day they published a list of the underrated sneaker cities of the world.
Do the sales of collectible sneakears on eBay match?
I wanted to show with the data I collected through the Insight fellowship last fall, how the data fared as far as clusters of activity. With LeafletJS, I was able to show with a heatmap the top cities of where folks sell sneakers through eBay. The results are not too surprising, as mentioned in the articles published by Complex.
Top Cities where Jordans + Yeezy sneakers are sold
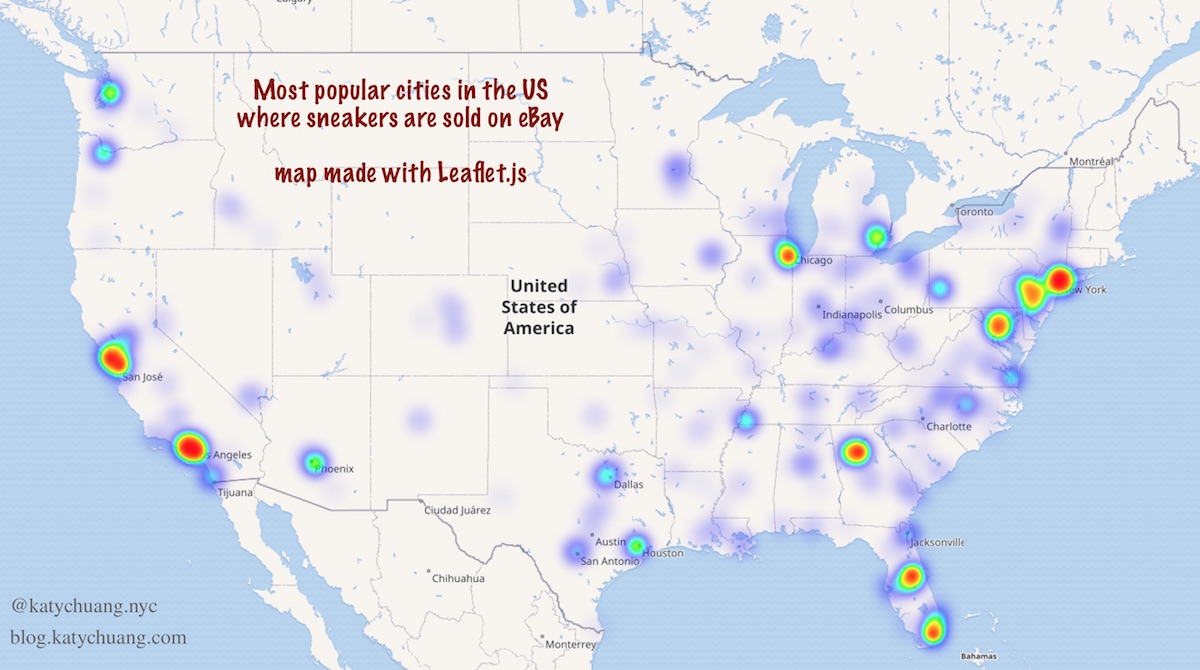
Top Cities (in no particular order):
- New York City (#1)
- Philadelphia (#14)
- DC
- Atlanta (Underrated #7)
- Miami (#10)
- Orlando
- Chicago (#5)
- SF (#7)
- LA (#4)
Up and coming cities (in no particular order):
Some of the cities matched the ones that Complex published. Other cities showed up, maybe because of changes with the availability of folks willing to part with collectible sneakers; maybe with the availability of folks who have time to create eBay listings.
The map is available here at this link. I used LeafletJS with the Leaflet.heat plugin.
How it’s made…
Assuming you have your base leaflet js layer all set up, you’ll want to then make sure to attach the heatmap plugin.
<script src="http://leaflet.github.io/Leaflet.heat/dist/leaflet-heat.js"></script>
Next you’ll want to set up the data into a nested array. I had my data saved as items from my list of dictionaries. I gave an arbitrary value of 0.12 for every occurrence of a city.
var x = [];
for (var i = 0; i < data.length-1; i++) {
    if ((typeof data[i].lat != "undefined") && (typeof data[i].lon != "undefined")){
       x.push([parseFloat(data[i].lat), parseFloat(data[i].lon), 0.12]);
    } //end if
} //end for loop
Before using the for loop I was trying to use the jQuery map function and it wouldn’t work. After comparing the vanilla JS for loop with Map, I ended up picking the for loop. It’s supposed to be faster and it run without errors.
](/assets/img/post/2016/02/1602-forloopvsmap.png)
Once you have your data prepared in a nested array format, you can create a heatmap layer and pass in that array. This is how it might look like:
var heat = L.heatLayer(x, {
    radius: 15,
    blur: 20,
    maxZoom: 6,
}).addTo(map);