The past week I was working on a data visualization project. First, I prototyped it in Python (later rewritten in Haskell). The first couple of days, I spent the whole weekend setting up my computer with the right libraries and fixing installation errors. Was also learning to connect with the Facebook Graph API. Finally towards the end of the weekend I was able to move beyond devops-y things like setup and configs to finally make progress with actual coding.
The goal of the exercise was to connect with Facebook Graph Api to collect information about my most recent posts, and see how my posting activity looks like.
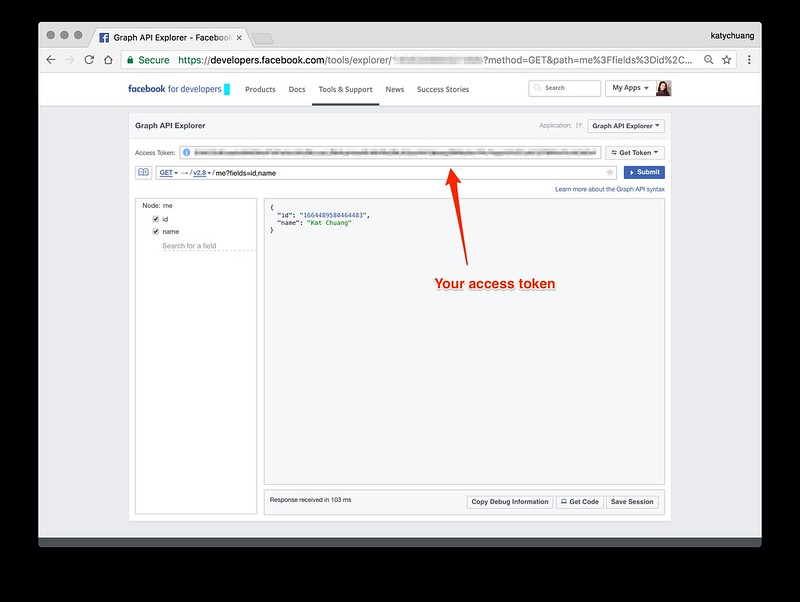
Table of Contents
Connecting to the Facebook Graph API
You’ll need to get an access token to download data, it’s unfortunately a bit complex to figure out. Since I was under a bit of a time crunch, I used the graph api explore page to generate a token, then copy and paste that to the text file mentioned below. It expires after an hour or so, which is fine if you’re getting a small sample like this example.
The code below will be in Python, and also available as an ipython notebook view: part 1, part 2
1. Setup
- Register for a facebook API and get your access token.
- I first created a virtual environment specifically for this project:
mkvirtualenv --python=/usr/local/bin/python3 dataAnalysisand installed these libraries - Then installed the Jupyter notebook server to the machine. Instructions can be found here
- Start server in the project’s root directory, jupyter notebook
- In addition to getting the console ready, I saved my access token information in a separate local folder,
_keysin a file namefacebook.py. Inside you want to save a string variable like the following:
ACCESS_TOKEN="XXXXXX"
2. Making Requests
Once all that is set up, you want to use the requests library to grab json data. I was able to figure out the urls to use based on the graph api explorer tool.
from _keys.facebook import USER_ID, ACCESS_TOKEN, paging_token
import requests

host = 'https://graph.facebook.com/v2.8'

u = '{}/{}/posts?access_token={}'.format(host, USER_ID, ACCESS_TOKEN)
data1 = requests.get(u).json()

pg2 = '{}/{}/posts?limit=25&until=1486832400&__paging_token={}&access_token={}'.format(host, USER_ID, paging_token, ACCESS_TOKEN)
data2 = requests.get(pg2).json()

data = []
data.extend(data1["data"])
data.extend(data2["data"])
The JSON data is saved into the variable data,which is a list of dictionaries, so we can now use the data structure functions to access information for each story. You can print the most recent post’s timestamp for verification:
print(data[0]['created_time'])
3. Parsing JSON data and formatting time
The next step is to save this data for analysis. We could save it into a text file. We could save it into a database. Since this is a small amount of data (n=46), I chose to iterate quickly on developing the code by loading the JSON response directly into a Python dataframe.
Let’s see what happens when we parse the timestamps:
import datetime
from dateutil.parser import parse

# return
def scrub(timestamp):
    d = parse(timestamp)
    return dow(d), hod(d)

# returns day of week
def dow(date): return date.strftime("%A")

# returns hour of day
def hod(time): return time.strftime("%-I:%M%p")

a = list(map((lambda x: scrub(x['created_time'])), data ))
Above, I selected the datetime and dateutil parser libraries. They come in the core python install, but you’d still have to import their modules for use in your file(s). I wrote this in a functional style because it’s easier for me to read (3 utility functions followed by mapping function). The bottom-most line is the overarching plot. It basically says, go through this json data that we just collected, for each record in data, scrub the timestamp.
Function scrub takes the timestamp (It’s a string type when read from json), uses parse() to turn into a datetime type, then processed to find the day of the week and hour of the day. The dow() and hod() each take a datetime type and return a string formatted version. The time formats are explained here
Which days am I most likely to post?
Let’s try using what we learned above to answer the question, Which days am I most likely to post on Facebook?. Say we have a list of the days of the week, days…. we can use this as an index while counting through the sample, daysIPosted2FB. Note that daysIPosted2FB is a one line version of earlier code example.
days=["Monday","Tuesday","Wednesday","Thursday","Friday","Saturday","Sunday"]
daysIPosted2FB = list(map((lambda x: parse(x['created_time']).strftime("%A")), data ))

print("day\t\tposts")
print("===========    =======")
for day in days:
    print (day, " \t", daysIPosted2FB.count(day))
The results are:
day		posts
===========    =======
Monday  	 2
Tuesday  	 3
Wednesday  	 8
Thursday  	 8
Friday  	 7
Saturday  	 6
Sunday  	 12
4. Saving data to a file
At this point, because you just learned how to collect data from json and parse it, let’s save the file so that you have it as backup in case the internet breaks. ![]()
You can easily save the list of dictionaries to a text file using the method json.dump() like so:
import json

with open(output_file, 'w') as jsonfile:
    json.dump(data, jsonfile)
Think that’s enough for now, going to continue writing up part 2 this weekend!
Don’t forget that the code in this post is available as an ipython notebook as well.